WRITING TASK 1
You should spend about 20 minutes on this task.
The graph below shows the production levels of the main kinds of fuel in the UK between 1981 and 2000.
Summarize the information by selecting and reporting the main features and make comparisons where relevant.
You should write at least 150 words.
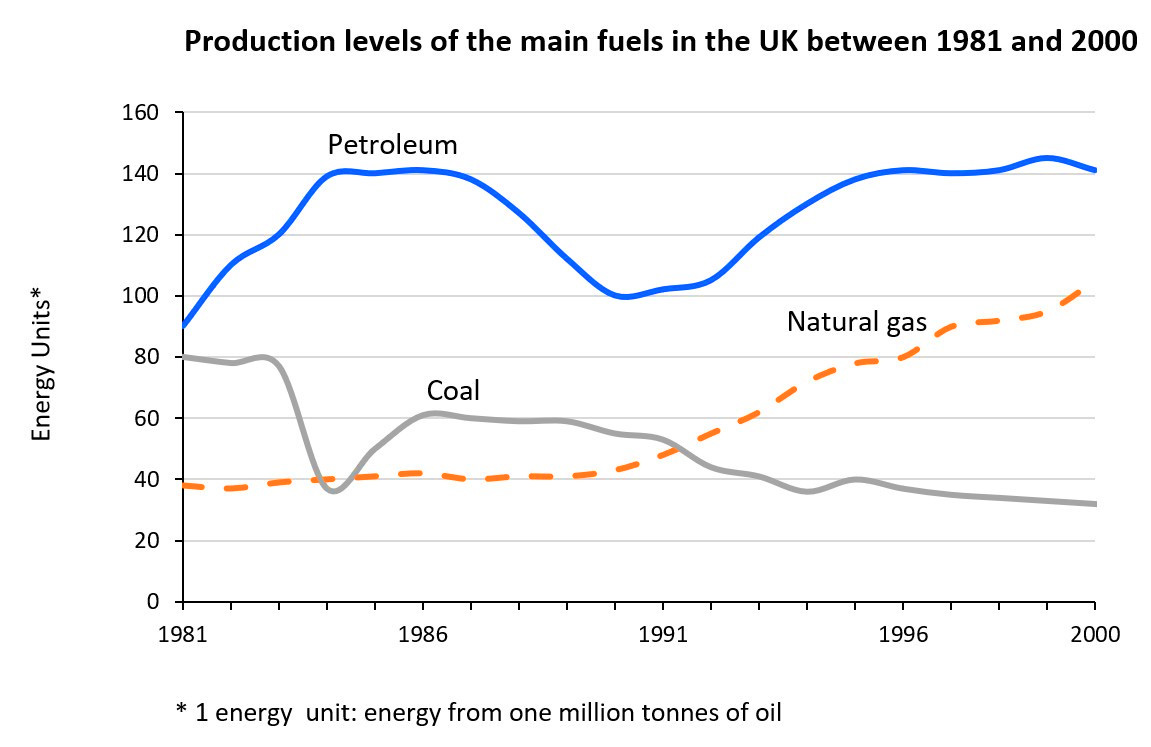
* 1 energy unit: energy from one million tonnes of oil
WRITING TASK 2
You should spend about 40 minutes on this task.
In some countries university students live at home with their family while they study, whereas in other countries students attend university in another city.
Do you think the benefits of living away from home during university outweigh the disadvantages?
Give reasons for your answer and include any relevant examples from own knowledge or experience.
You should write at least 250 words.